
Below is the current data and demographics for the programs and clients served at the Mesilla Valley Community of Hope
Stats at a Glance!
*Scroll further down to see a more detailed breakdown for each Fiscal Year
Mesilla Valley Community of Hope End of Fiscal Year 2021-2022 Stats
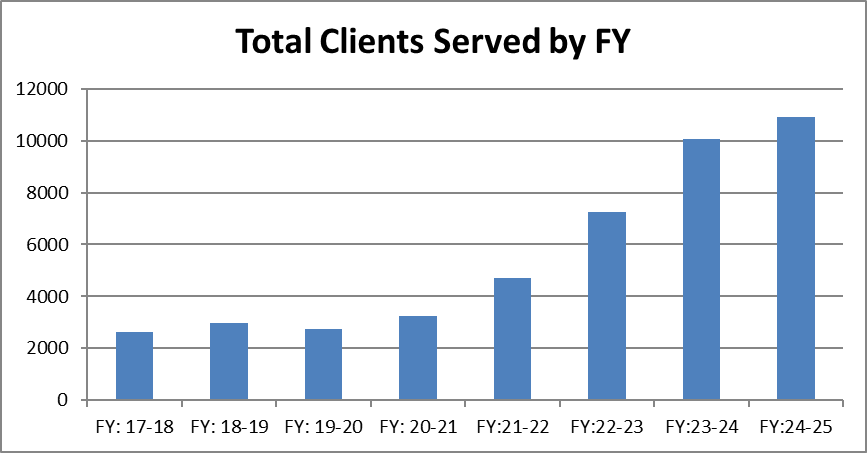
Total Clients: 4,714
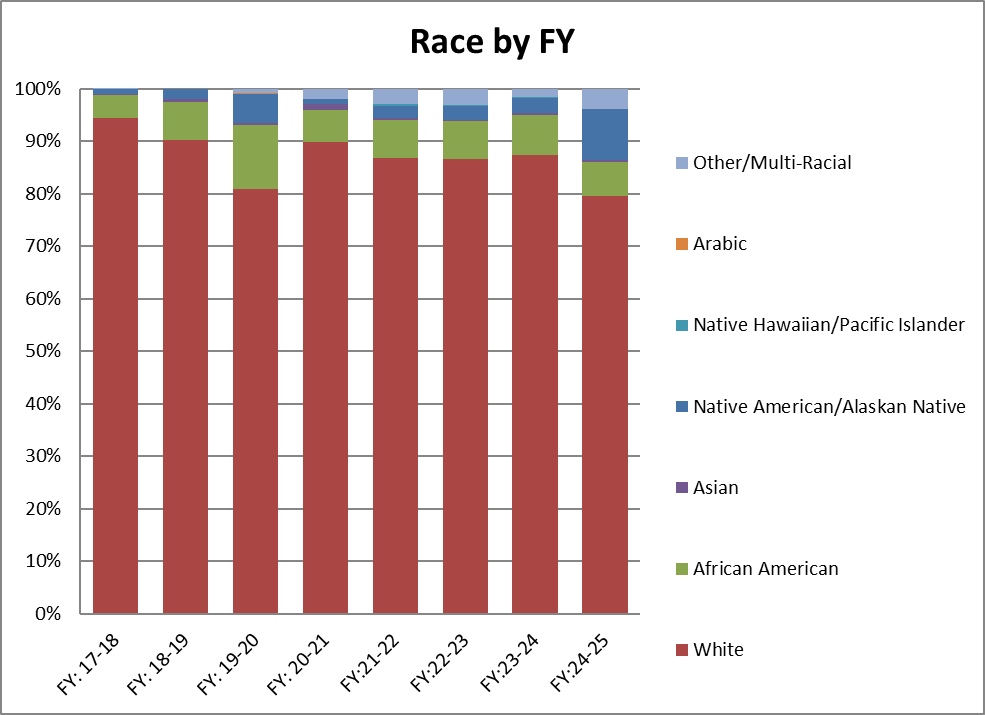
Race
White – 4,086
Black – 341
Native/Alaskan Native – 107
Asian – 15
Black+White – 10
Native Hawaiian/Pacific Islander – 20
Native+White – 7
Other- 35
Other Multi-Racial (HUD) – 93
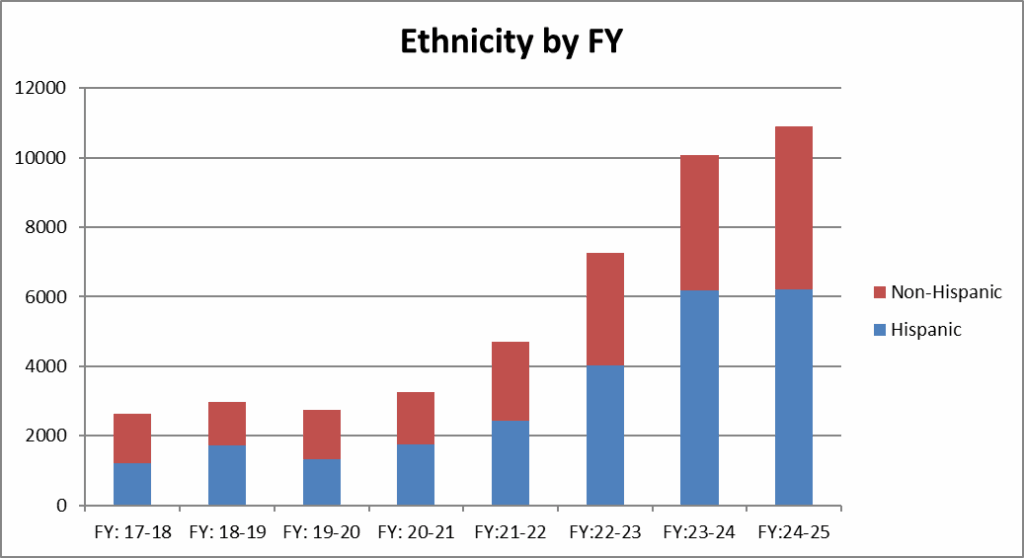
Ethnicity:
Hispanic – 2,436
Not Hispanic – 2278
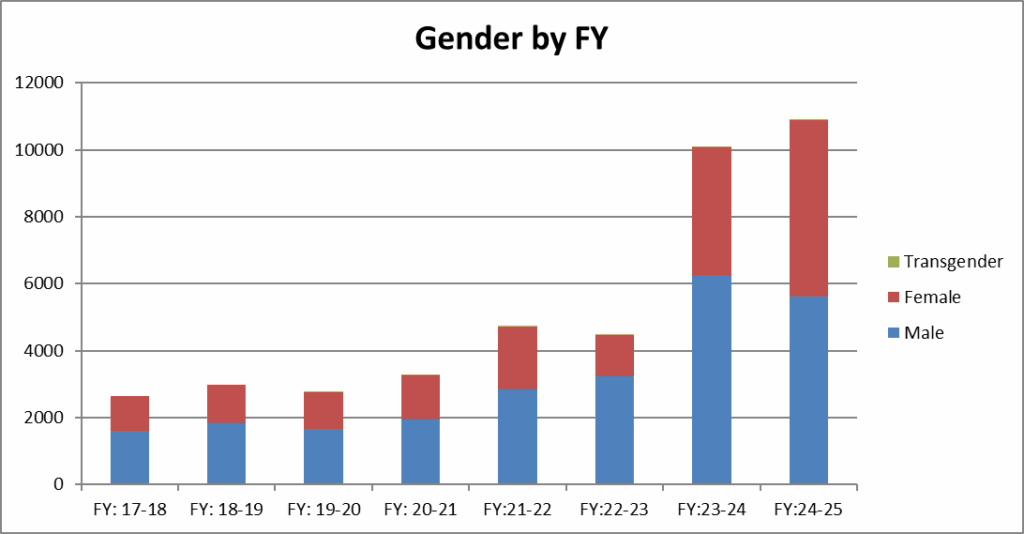
Gender:
Male – 2,836
Female – 1,870
Transgender – 8
Age Range:
18-89
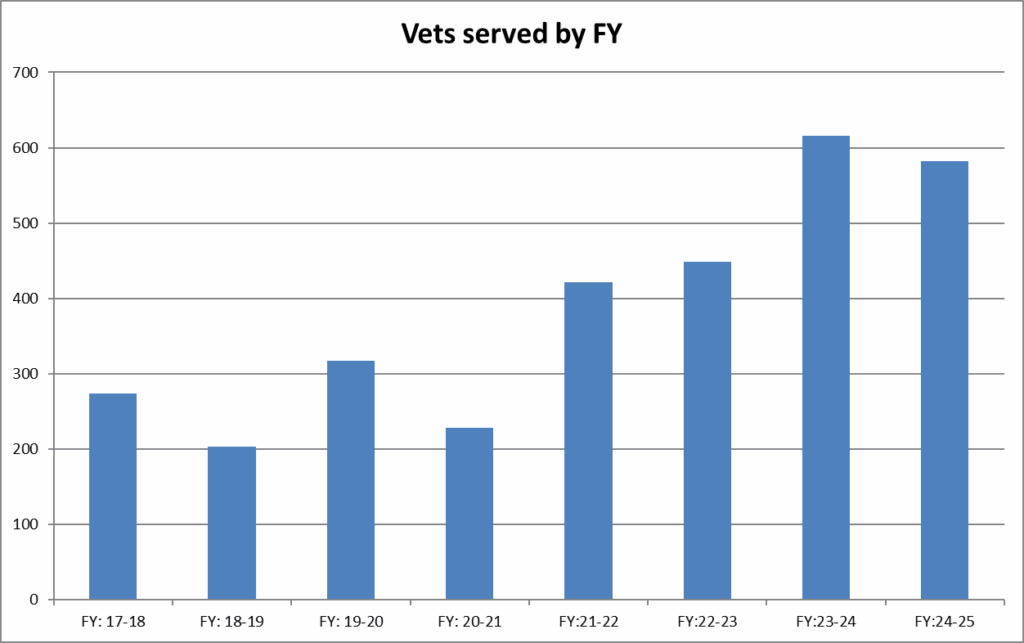
Vets – 421
New Chronically Homeless– 231
Total Services – 37,923
Shower – 2,612
R/R – 15,078
Phone – 1,030
Mail/Msgs – 10,258
Case Mgmt – 6,030
Laundry – 868
Locker – 983
Clothing – 852
Computer – 201
Legal – 11
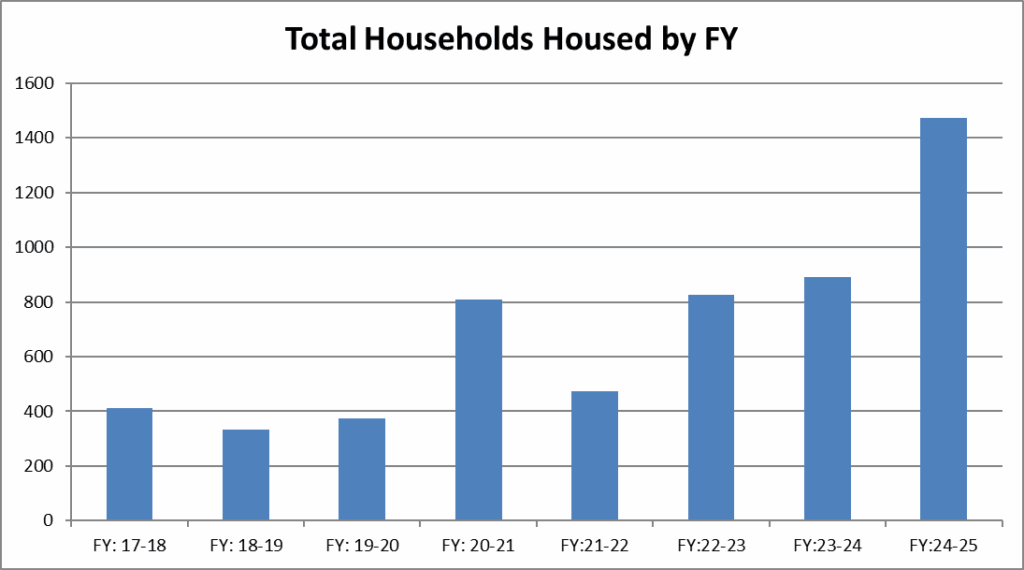
Total Households Housed – 475
# of people – 701
# of adults – 542
# of children – 158
# of vets – 104
# with increased income – 80
# who had employment at exit – 61
Total people helped with utilities – 894
Total Vets Helped with Utilities – 25
Mano y Mano
Unique People Worked – 276
Men – 212
Women – 64
Total Times Worked – 4,791
Camp Hope
Total People Served – 277
Male – 204
Female – 71
66 went into housing:
55 Went into MVCH programs
11 Self-Housed
1 Was placed into other housing programs
Covid-19 Assistance
We helped 39 total households for a total of 82 people.
SOAR
50 Services provided to clients; 37 unique individuals served. 4 approvals.
Volunteer Hours
17,738 hours donated, equaling $209,212 in donated hours
Mesilla Valley Community of Hope End of Fiscal Year 2020-2021 Stats
Total Clients Served: 3,263
Race:
White – 2958
African American – 203
Native/Alaskan Native – 33
Asian – 6
Black+White – 3
Native Hawaiian/Pacific Islander – 4
Native+White – 2
Other- 2
Other Multi-Racial (HUD) – 50
Ethnicity:
Hispanic – 1762
Not Hispanic – 1501
Gender:
Male – 1952
Female – 1311
Transgender – 2
Age Range:
18-87
Vets – 228
New Chronically Homeless- 98
Total Services – 33,044
Shower – 2666
R/R – 13368
Phone – 1078
Mail/Msgs – 8022
Case Mgmt – 5198
Laundry – 731
Locker – 1166
Clothing – 457
Computer – 342
Legal Clinic – 16
Total Households Housed – 809
# of people – 1290
# of adults – 1032
# of children – 258
# of vets – 85
# with increased income – 91
# who had employment at exit – 17
Total people helped with utilities – 1396
Total Vets Helped with Utilities – 33
Mano y Mano
Unique People Worked – 568
Men – 438
Women – 130
Total Times Worked – 5,040
Camp Hope
Total People Served – 254
Male – 167
Female – 87
54 went into housing:
43 Went into MVCH programs
4 Self-Housed
6 Were placed into other housing programs
Covid-19 Assistance
We helped 392 total households for a total of 1,010 people.
SOAR
69 Services provided to clients; 53 unique individuals served. 5 approvals.
Veteran Mental Health Visits – 483 sessions
Volunteer Hours
12,328 hours donated, equaling $147,073 in donated hours
Mesilla Valley Community of Hope End of Fiscal Year 2019-2020 Stats
Total Clients Served – 2,744
– Race
White – 2,221
American Indian- 152
African American- 335
Asian- 9
Native Hawaiian- 2
Arabic- 2
Other/Multi-racial- 23
– Ethnicity
Hispanic- 1,341
Non-Hispanic- 1,403
– Gender
Male- 1,640
Female- 1,102
Trans- 2
– Age range:18-95
–Vets- 317
–New Chronically Homeless: 60
–Total Services Provided– 36,339 (average of 13.2 per client)
Shower- 2,686
Phone- 1,846
Mail/Msgs- 9,607
Case Management- 5,389
Laundry- 1,051
Locker- 1,324
Computer- 473
Clothing- 601
Legal Clinic- 41
Total Households Housed: 373
# of people- 570
# of adults- 420
# of children- 150
# of vets- 69
# with increased income- 73
# who had employment at exit- 43
Total people helped with Utilities: 870
Total vets helped with Utilities: 82
Mano y Mano
Unique People Worked- 733
Men- 553
Women- 180
Total Times Worked – 4,144
Camp Hope
Total Served – 234
Male- 173
Female- 61
Of the 62 people who exited Camp Hope into housing:
9 of them self-resolved their housing needs
7 went into other housing programs & amp
46 went into MVCH programs.
COVID-19 Assistance:
We helped 192 people (92 households) with mortgages, rent, and motel stays;
SOAR- 110 Services provided to clients; 58 unique clients served. 22 housed. 10 approved.
Veteran Mental Health Visits- 652
Volunteer Hours: 11,830 hours donated, equaling $141,179 in donated hours
Mesilla Valley Community of Hope End of Fiscal Year 2018-2019 Stats
Total Clients Served: 2,971 (343 more than last year)
– Race
- White- 2,682
- Black- 217
- Asian- 14
- Native American- 58
– Ethnicity
- Hispanic- 1727
- Non-Hispanic- 1244
– Gender
- Male- 1,829
- Female- 1,142
– Age range: 18-92
–Vets- 203
–New Chronically Homeless: 90
–Total Services Provided– 30,600 (average of 10.7 services per client)
- Showers- 1,575
- R/R- 9,737
- Phone- 2,326
- Mail/Message- 8,180
- Case Management-5,740
- Laundry- 1084
- Locker- 545
- Computer- 874
- Clothing (not including migrants)- 493
- Lawyer- 46
- Birth Certs- 37
- ID Cards-16
- Bus Passes-134
Total Households Housed: 334
– # of people- 449
– # of adults- 372
– # of children- 77
– # of vets- 83
– # with increased income- 97
– # who had employment at exit- 44
Total people helped with Utilities: 891
Total vets helped with Utilities– 61
Total Volunteer Hours: 14,469
– Estimated Volunteer Hour Value- $147,149 (average of $563.79 every workday)
Mano y Mano
– 620 Unique people served
- 478 Men
- 142 Women
– Total times worked- 2,364
Camp Hope Total Served- 174
- Male- 130
- Female- 44
- Got Housing- 72
- Vets Served- 16
SOAR
– Total Clients- 137
ISSVF Mental Health Visits– 933
FY 17 – Jul 1, 2017 to Jun 30, 2018 (adjusted 08/29/2018)
- How many Clients Served 2628
- How many times? 17,004
- How many Vets were served 274 10%
- How many Clients were Housed 547
- Households? 412
- How many Obtained income 167 30%
- How many had Employment at exit 101 18%
- Helped with Utilities 81 15%
How many Adults? 418 76%
How many Children? 129 24%
Total people: 547
How many Vets? 81 15%
Vets helped with Utilities? 5
- Race
- White 2400 91%
- Black 112 4%
- Asian 5 0%
- Am Indian 21 1%
- Other 3 0%
- Unknown 87 3%
- Ethnicity
- Non-Hispanic 1425 54%
- Hispanic 1203 46%
- Male 1580 60%
- Female 1047 40%
- Transsexual 1
- Ages 18 – 87
- How Many Clients Served with SOAR? 133 Wins: 13
Sue: 82, 10 wins
Kat: 27, 2 wins
Lindsay: 24, 1 win
- How Many ISSVF Mental Health Visits? 2006 visits/ 26 clients
- How many served at Camp Hope? 187
- Found Housing 71 38%
- In SOAR Program 10 5%
- Men 138 74%
- Women 46 24%
- Transsexual 3 2%
- Camp Hope Vets? 24 13%
- Showers 1785
- Laundry 965
- Lockers 1018
- Birth Certificates 20
- **Note: only issuing B/C and ID’s occasionally now
- ID’s 11 Bus Pass: 7
- Volunteer Hours: 14, 203 = $147,876
- Camp Hope: 11362.5 = $113,625